Matchday 30
Quality recoveries & build-up play that offers guarantees
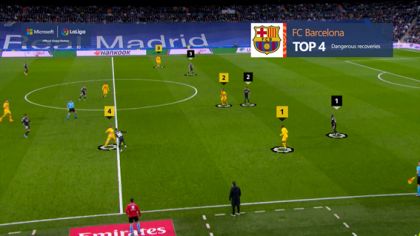
This video illustrates how recoveries can be distinguished not only in terms of their effectiveness, but also their quality. Barcelona record the fourth-most advantageous recoveries in the league, i.e. situations that involve a numerical advantage and where the side in possession has more players ahead of the ball than the opposition.
Given the importance of build-up play in the system deployed by Xavi’s troops, the team’s set-up at the start of the attacking transition is key. This video shows how the Barcelona players react in these situations. It’s worth pointing out that 15% of the Catalan giants’ recoveries put them at an advantage.
Madrid aim to advance up the pitch & prove their potency
Real Madrid are the LaLiga Santander front runners for the number of carries leading to shots, with four per game to their name. Carries can be analysed from a whole host of angles, but in this case we’re keen to look at their outcome, i.e. shots.
There’s no question that Ancelotti’s charges are capable of making the most of these actions, as illustrated in our Clip of the Week. The players’ ability to go past their man, their skill level and decision-making ability are key to the success of such actions, which can reap rich rewards for the capital club.
Atletico Madrid & their carries leading to shots
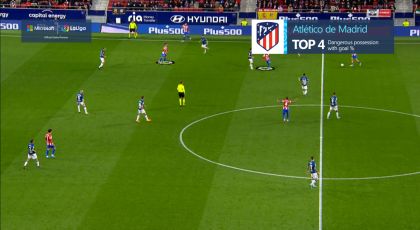
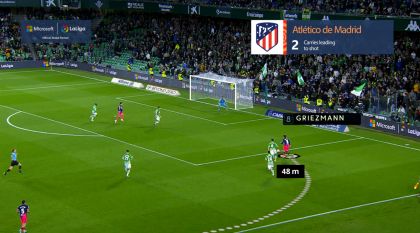
As we can see in this clip, Simeone’s boys post an average of two carries that lead to shots per game. Indeed, this is one of Atleti’s favourite tactics to pose a threat on goal. If we dive deeper and take a look at what the Wanda Metropolitano-based outfit do in possession, we learn that they feature amongst the league’s top five teams for the number of players per possession (almost three), whilst they find themselves amongst the division’s leading five teams for the number of dangerous possessions per match (4.6).
Betis & their breathtaking dangerous possessions
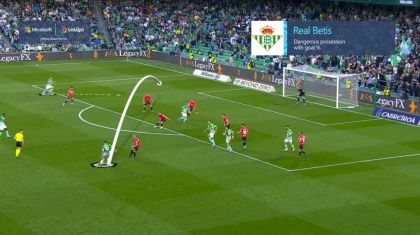
When it comes to possession, there are a whole host of aspects that we can analyse, with one of them being the degree of danger created. When we speak of dangerous possessions, we’re referring to those that end in a goal or a goalscoring opportunity. This video features a dangerous possession put together by Manuel Pellegrini’s charges. Betis excel in this department and lie second in the LaLiga standings for the number of dangerous possessions (5.7 per outing).
Dangerous possessions that result in goalscoring chances
The Real Madrid players ensure that their team balance enables them to consistently produce and improve on their statistics as the games goes on. As we can see in the latest instalment of Clip of the Week, the Blancos record more dangerous possessions than any other side in the league (6.76 per game) and, crucially, they make them count.

It’s your Game
Matchday 30
Valencia CF
Cádiz CF
SUN 03.04.2022
18:30

Season 2021/2022
Camp de Mestalla
FC Barcelona
Sevilla FC
SUN 03.04.2022
21:00
Season 2021/2022
Spotify Camp Nou
Valencia CF
Cádiz CF
SUN 03.04.2022
18:30
Season 2021/2022
Matchday 30
Camp de Mestalla
Bordalas’s blueprint: high-octane football & impressive shot conversion
When it comes to any discussion of Valencia, one thing is for sure and that’s that they boast an instantly recognisable playing style. One element of their system is reflected by the fact that no other LaLiga Santander side completes more actions at over 28km/hr (30.6 per outing) than the boys from Mestalla. If we look at the initial passes in their attacking transitions, we discover that the Valencians rank fourth in the top-flight charts for the percentage of forward passes following a turnover (59%). Meanwhile, in terms of their possession, 31% is in the opposition’s half, a figure which puts them fifth in the league standings.
It is well worth underscoring the team’s efficiency in front of goal. Los Che sit pretty in fourth in the LaLiga Santander standings for shot conversion (13.2%). However, if there’s one area of the attacking phase where Bordalas’s boys really excel, it’s on set pieces. Valencia lie top of the league pile in terms of the number of deadballs per game (almost 16). We also mustn’t forget the team’s ability to counter the opposition’s attacking threat, with the Valencians top dogs for the number of opposition attacks that are broken down (almost 30 per game).
Gonzalez’s keys to hoisting Cadiz from drop zone in four-month spell
Cadiz’s playing style has undergone a clear facelift since Sergio Gonzalez took up the reins. The Spanish tactician was appointed in mid-January to engineer an upturn in fortunes for a side that had secured just two wins in the opening 20 matchdays.
If we take a closer look at the changes that have been introduced we note that, under Gonzalez’s tutelage, the Costa de la Luz outfit have picked up twice as many points per game at 1.5, which has seen them rise from 18th position to eighth in these particular standings. Meanwhile, in terms of points per goal, the Andalusians have also upped their game and the ratio of 1.5 and second spot in the league charts contrasts sharply with the 0.8 ratio that saw them languish down in 17th.
It is worth honing in on both ends of the pitch as we analyse and discover the systems that have changed. Since Gonzalez checked in, the team has registered 4.3 passes per possession, which is enough to secure 10th place in the league standings for this facet, in which Cadiz stood rock bottom under the previous manager. At the other end of the pitch, it’d be amiss of us not to mention the team’s performance in terms of defensive containment, i.e. the side’s ability to prevent the opposition from posing a threat on goal. The side’s score in this area has jumped from 80% to 86% as the Amarillos have climbed from bottom spot to fourth place in the competition standings.
PLAYER FOCUS
Crossing maestro Soler is key difference-maker
Many aspects of Carlos Soler’s game make him a leading light in the Valencia ranks. As we can see in this clip, his passes, which beat an average of 3.3 opponents, are capable of making all the difference. Meanwhile, he covers more ground per match than any of his teammates (an average of 10.8km per outing).
If we dive deeper in our analysis of the Spaniard’s ability to create play, we simply have to mention his supreme crossing ability. He completes an average of 5.5. crosses per game, which places him amongst the top 15 players in LaLiga Santander for the number of crosses delivered. In terms of the quality of his crosses, he posts a 29.5% success rate, a return that sees him lead the way in the Valencia charts and puts him amongst the front runners across the league as a whole.
Metric of the Week
Matchday 30
Find out the meaning of each metric
Number of players involved per possession offers clear indication of team’s style
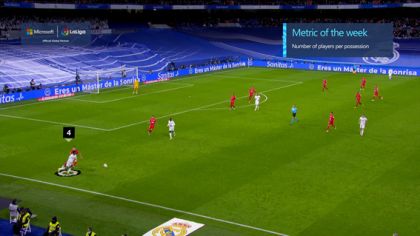
There are a number of ways in which a team’s possession can be defined, with the number of players involved in them being one of the methods that we analyse. This criteria measures how many team members touch the ball during the course of an attacking transition. Teams whose game involves more intricate build-up play and possessions typically feature more players per possession.
As this video illustrates, Real Madrid are the LaLiga Santander champions for the number of players involved per possession, with an average of 3.67 per outing.
HOW IT'S MADE
Beyond Stats offers incredible metrics which go beyond the ordinary in the football industry: it does not limit itself to gathering the data normally used for the standard analyses that reach fans, but goes one step further, collecting a vast amount of in-match information, almost in real time, thanks to LaLiga’ s Mediacoach proprietary tool, that is capable of revealing new perspectives on the game at a deeper level, allowing patterns to be traced and future predictions to be made.
In every LaLiga stadiums we have up to sixteen high-resolution, fixed perimeter cameras for optical tracking which follow the positions of the players, referees, and the ball on the field of play, collecting the physical and technical/tactical data at the dizzying rate of 25 times a second. These devices permit the integration, through the Mediacoach analysis tool, of two technologies: tracking and eventing. Tracking is based on the positional information collected by the stadium perimeter cameras and allows for the generation of metrics such as distance covered, top and average speeds, and number of sprints. Eventing allows more objective events to be recorded: number of passes, corners, and fouls committed and received, for example. The information captured through tracking and eventing is integrated and stored in the system forming a high-volume set of data.
The raw data collected is processed for analysis by a multidisciplinary team composed of LaLiga experts in business intelligence & analytics and football analysis, through machine learning and artificial intelligence processes made possible thanks to the Azure technology supplied by Microsoft, which is capable of processing large volumes of data. After processing, an algorithm is generated that permits the visualisation of the metrics that reach fans through Beyond Stats. These statistics allow fans to better understand why their team has won or lost a match, or to benefit from a panoramic view of their performance and expectations, gifting football fans an unprecedented immersion in the experience.
Find out the meaning of each metric
Carries that break opposition’s defensive line
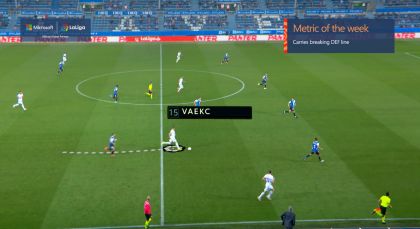
Overcoming a team’s defensive line is certainly no mean feat. Many sides turn to carries as a means to break opposition lines and create goalscoring opportunities. Carries involve taking the ball past opposition players and, in this case, breaking the defensive line. The aim is to create overloads and advantageous situations to carve out chances, some of which see teams ending up with just the opposition’s goalkeeper to beat. Players who have the ability to carry the ball at high speeds tend to excel in this department.
HOW IT'S MADE
Beyond Stats offers incredible metrics which go beyond the ordinary in the football industry: it does not limit itself to gathering the data normally used for the standard analyses that reach fans, but goes one step further, collecting a vast amount of in-match information, almost in real time, thanks to LaLiga’ s Mediacoach proprietary tool, that is capable of revealing new perspectives on the game at a deeper level, allowing patterns to be traced and future predictions to be made.
In every LaLiga stadiums we have up to sixteen high-resolution, fixed perimeter cameras for optical tracking which follow the positions of the players, referees, and the ball on the field of play, collecting the physical and technical/tactical data at the dizzying rate of 25 times a second. These devices permit the integration, through the Mediacoach analysis tool, of two technologies: tracking and eventing. Tracking is based on the positional information collected by the stadium perimeter cameras and allows for the generation of metrics such as distance covered, top and average speeds, and number of sprints. Eventing allows more objective events to be recorded: number of passes, corners, and fouls committed and received, for example. The information captured through tracking and eventing is integrated and stored in the system forming a high-volume set of data.
The raw data collected is processed for analysis by a multidisciplinary team composed of LaLiga experts in business intelligence & analytics and football analysis, through machine learning and artificial intelligence processes made possible thanks to the Azure technology supplied by Microsoft, which is capable of processing large volumes of data. After processing, an algorithm is generated that permits the visualisation of the metrics that reach fans through Beyond Stats. These statistics allow fans to better understand why their team has won or lost a match, or to benefit from a panoramic view of their performance and expectations, gifting football fans an unprecedented immersion in the experience.
Conoce el significado de cada métrica
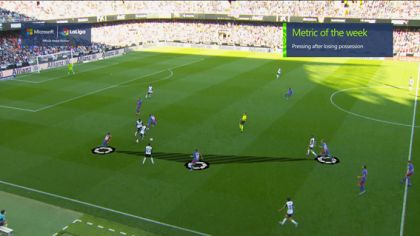
Presión tras pérdida
Las presiones tras pérdida persiguen recuperar la posesión del esférico desde el mismo momento en el que se pierde la misma. El estilo de los de Xavi sigue haciendo de la posesión una de las claves básicas del juego del equipo. Precisamente, en busca de esta posesión, el Barcelona protagoniza presiones tras pérdida en las que forman parte, de media, 3,2 jugadores. Esta cifra es la segunda más alta de toda la competición y permite al equipo recuperar balones en campo rival. Con ellas regeneran las transiciones ofensivas en zonas más cercanas a meta rival.
HOW IT'S MADE
Beyond Stats offers incredible metrics which go beyond the ordinary in the football industry: it does not limit itself to gathering the data normally used for the standard analyses that reach fans, but goes one step further, collecting a vast amount of in-match information, almost in real time, thanks to LaLiga’ s Mediacoach proprietary tool, that is capable of revealing new perspectives on the game at a deeper level, allowing patterns to be traced and future predictions to be made.
In every LaLiga stadiums we have up to sixteen high-resolution, fixed perimeter cameras for optical tracking which follow the positions of the players, referees, and the ball on the field of play, collecting the physical and technical/tactical data at the dizzying rate of 25 times a second. These devices permit the integration, through the Mediacoach analysis tool, of two technologies: tracking and eventing. Tracking is based on the positional information collected by the stadium perimeter cameras and allows for the generation of metrics such as distance covered, top and average speeds, and number of sprints. Eventing allows more objective events to be recorded: number of passes, corners, and fouls committed and received, for example. The information captured through tracking and eventing is integrated and stored in the system forming a high-volume set of data.
The raw data collected is processed for analysis by a multidisciplinary team composed of LaLiga experts in business intelligence & analytics and football analysis, through machine learning and artificial intelligence processes made possible thanks to the Azure technology supplied by Microsoft, which is capable of processing large volumes of data. After processing, an algorithm is generated that permits the visualisation of the metrics that reach fans through Beyond Stats. These statistics allow fans to better understand why their team has won or lost a match, or to benefit from a panoramic view of their performance and expectations, gifting football fans an unprecedented immersion in the experience.
Find out the meaning of each metric
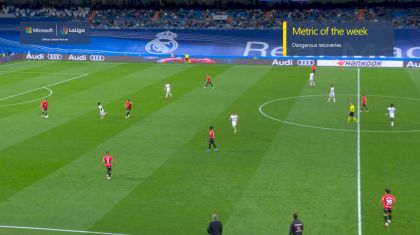
Dangerous recoveries & opponents ahead of the ball
Dangerous recoveries are all about the level of willingness displayed by the players on our side and opposition players after possession has changed hands. This video of Real Madrid in action highlights the importance of creating advantages by having a high number of players ahead of the ball and as few opponents as possible once possession is regained.
HOW IT'S MADE
Beyond Stats offers incredible metrics which go beyond the ordinary in the football industry: it does not limit itself to gathering the data normally used for the standard analyses that reach fans, but goes one step further, collecting a vast amount of in-match information, almost in real time, thanks to LaLiga’ s Mediacoach proprietary tool, that is capable of revealing new perspectives on the game at a deeper level, allowing patterns to be traced and future predictions to be made.
In every LaLiga stadiums we have up to sixteen high-resolution, fixed perimeter cameras for optical tracking which follow the positions of the players, referees, and the ball on the field of play, collecting the physical and technical/tactical data at the dizzying rate of 25 times a second. These devices permit the integration, through the Mediacoach analysis tool, of two technologies: tracking and eventing. Tracking is based on the positional information collected by the stadium perimeter cameras and allows for the generation of metrics such as distance covered, top and average speeds, and number of sprints. Eventing allows more objective events to be recorded: number of passes, corners, and fouls committed and received, for example. The information captured through tracking and eventing is integrated and stored in the system forming a high-volume set of data.
The raw data collected is processed for analysis by a multidisciplinary team composed of LaLiga experts in business intelligence & analytics and football analysis, through machine learning and artificial intelligence processes made possible thanks to the Azure technology supplied by Microsoft, which is capable of processing large volumes of data. After processing, an algorithm is generated that permits the visualisation of the metrics that reach fans through Beyond Stats. These statistics allow fans to better understand why their team has won or lost a match, or to benefit from a panoramic view of their performance and expectations, gifting football fans an unprecedented immersion in the experience.
Find out the meaning of each metric
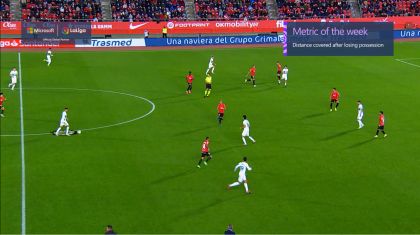
Distance covered after losing possession
Winning the ball back is essential to allowing teams to launch attacking transitions. When it comes to regaining possession, the way in which teams manage the distance after losing the ball, i.e. the distance travelled from the moment possession is relinquished, is a key factor. The distance is dependent on a host of factors, including the team’s height on the pitch and other elements of their tactical set-up. This clip features a move that shows the distance covered by Elche after losing possession.
HOW IT'S MADE
Beyond Stats offers incredible metrics which go beyond the ordinary in the football industry: it does not limit itself to gathering the data normally used for the standard analyses that reach fans, but goes one step further, collecting a vast amount of in-match information, almost in real time, thanks to LaLiga’ s Mediacoach proprietary tool, that is capable of revealing new perspectives on the game at a deeper level, allowing patterns to be traced and future predictions to be made.
In every LaLiga stadiums we have up to sixteen high-resolution, fixed perimeter cameras for optical tracking which follow the positions of the players, referees, and the ball on the field of play, collecting the physical and technical/tactical data at the dizzying rate of 25 times a second. These devices permit the integration, through the Mediacoach analysis tool, of two technologies: tracking and eventing. Tracking is based on the positional information collected by the stadium perimeter cameras and allows for the generation of metrics such as distance covered, top and average speeds, and number of sprints. Eventing allows more objective events to be recorded: number of passes, corners, and fouls committed and received, for example. The information captured through tracking and eventing is integrated and stored in the system forming a high-volume set of data.
The raw data collected is processed for analysis by a multidisciplinary team composed of LaLiga experts in business intelligence & analytics and football analysis, through machine learning and artificial intelligence processes made possible thanks to the Azure technology supplied by Microsoft, which is capable of processing large volumes of data. After processing, an algorithm is generated that permits the visualisation of the metrics that reach fans through Beyond Stats. These statistics allow fans to better understand why their team has won or lost a match, or to benefit from a panoramic view of their performance and expectations, gifting football fans an unprecedented immersion in the experience.