Web Clubs

LALIGA

Institutional

LALIGA

with sport

LALIGA

Group

LALIGA

INSTITUTIONAL

LALIGA WITH

SPORT

LALIGA

GROUP

Fact of the week

Creating goals at breakneck speed

In the attacking phase, Real Madrid have the ability to create dangerous chances with regularity, so much so that they are the LALIGA team with the most high-impact attacking actions per match, with 19. Which is why today we wanted to analyse whether Los Blancos also stand out on demanding physical actions, and it turns out that they do. They are the team who cover the greatest distance at over 28 km/h, the team that does so the most in possession, and they are among the top five at these speeds out of possession. Carlo Ancelotti’s charges are capable of maintaining their intensity in every phase of the game.

Share

Remarkable Coach

Ruben Baraja cements a new dynamic.

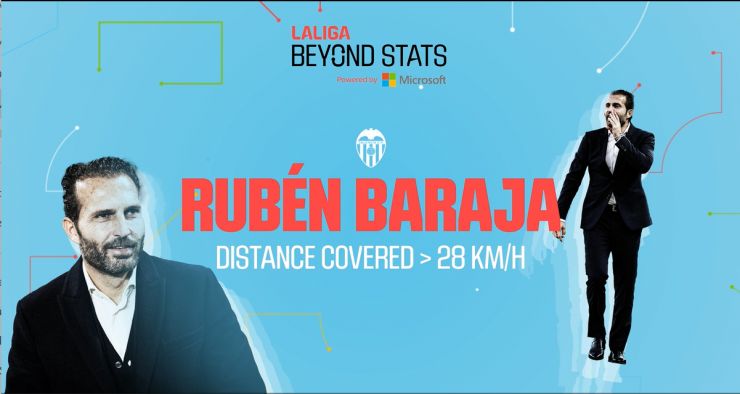
The Valladolid-born coach is proving his worth, with his team in seventh place. There are many facets of Valencia CF’s game which we can examine, but first to highlight are the following defensive stats. Valencia are the team who recover the third-most balls thanks to their pressing, and the team with the fourth-most high-intensity pressures. Their proactive approach to regaining possession allows them to create situations which they can capitalise on. Actions of this nature require a great deal of exertion from the players, as evidenced by the fact that they lie fourth in the division on distance covered at the highest speeds (28 km/h). As we can see, there is a solid rationale behind Valencia’s upturn.

Share

Key Player

Yuri gets goals too.

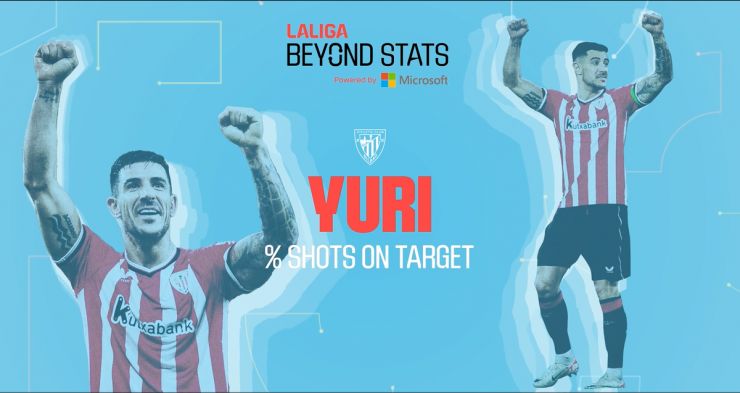
The full-back is an important player for Ernesto Valverde, and his stats help us to understand why. As we can see in the video for this segment, Yuri Berchiche has the ability to score goals, even from difficult shooting opportunities. He gets 36% of his shots on target and is the player on his team who makes the fourth-most passes, ensuring that his flank takes on a more prominent role in Athletic Club’s game when he is on the pitch. What’s more, his passes gain significant ground: he is the Athletic player whose passes cover the third-longest distance. In other words, not only does he pass a lot, but when he does so he has the ability to break the lines and get his team up the pitch.

Share

The Match up

Leadership on the line: Real Madrid v Girona.

Without a doubt, this is the most exciting game of the matchday if we focus on the LALIGA leadership. However, it is not just the situation with the league table that promises a great game, but also what has been happening on the field of play. Girona place 40% of their shots on target, and this effectiveness has helped them to shine all season. As we can see in the radar chart, Girona have the edge on finishing efficiency, but there are other metrics such as the number of passes in attack or total shots where Real Madrid come out on top. We will have to keep a close eye on both boxes if we want to catch every detail of what will surely be a great game and an exhibition in effectiveness and key actions.

Share

Remember his name

Vitor Roque proves to be a strong performer.

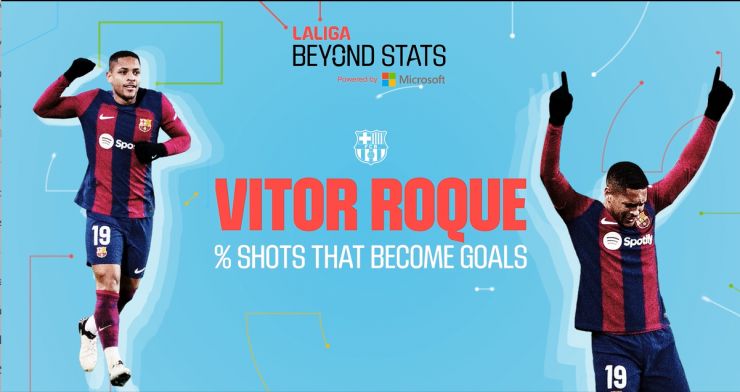
In total, we can tot up 93 minutes played by the Barcelona player this season, and some interesting things have happened during his time on the pitch. Most important are his two goals, but these were not isolated actions: 25% of his shots end in a goal, and he has taken eight shots in total. He has also generated four high-impact attacking actions and in a little over 90 minutes he has played 10 passes in the final third. There is no question that his first forays are cause for excitement.

Metric of the week

Players involved in the press.

It is not just the number of pressures applied by a team or a player which matters. There are a host of other minutiae which we can look at surrounding this defensive strategy: whether the press is effective, where on the pitch it is applied... But today our focus falls on something else: how many players are involved? It is possible to determine how many players are taking part in a team’s press, and then we can use this figure to produce an average per match. This stat helps us to understand the team’s overall involvement in these actions.

Te explicamos cómo obtenemos estos datos de prepartido a través de la mejor tecnología

Beyond Stats ofrece métricas increíbles en la industria del fútbol: no se limita a recopilar los datos que se suelen usar para los análisis estándarque llegan a los aficionados, sino que va más allá, recopilando una cantidad ingente de información durante el partido, casi en tiempo real, gracias a la herramienta Mediacoach de LALIGA, que es capaz de revelar nuevas percepciones sobre el juego a un nivel más profundo permitiendo trazar patrones y obtener proyecciones de futuro.

Los datos brutos recogidos (Raw Data) son tratados para su análisis por un equipo multidisciplinar compuesto por expertos en Business Intelligence & Analytics y análisis futbolístico de LALIGA a través de procesos de Machine Learning e Inteligencia Artificial que se han hecho posibles gracias a la tecnología Azure que provee Microsoft, capaz de procesar grandes volúmenes de datos. Tras su tratamiento, se genera un algoritmo que permite la visualización de las métricas que llegan al aficionado por medio de Beyond Stats. Estas estadísticas permiten a los aficionados entender mejor por qué su equipo ha ganado un partido, lo ha perdido, o tener una visión panorámica de su rendimiento y expectativas, lo que permite una inmersión inédita en la experiencia del espectador de fútbol.

En todos los estadios de LALIGA encontramos hasta dieciséis cámaras perimetrales fijas de alta resolución para el tracking óptico que siguen en el terreno de juego la situación de jugadores, árbitros y balón, recogiendo datos físicos y técnico-tácticos a un ritmo vertiginoso de 25 veces por segundo.

“Encontramos hasta dieciséis cámaras perimetrales fijas de alta resolución para el tracking óptico”

Estos dispositivos permiten la integración, a través de la herramienta de análisis Mediacoach, de dos tecnologías: tracking y eventing. El tracking se apoya en la información de seguimiento recogida por las cámaras perimetrales del estadio, y permite elaborar métricas como las referidas a distancia recorrida, velocidad máxima y media, o número de sprints. Mediante el eventing se registran los eventos más objetivables: número de pases, córners, o faltas cometidas y recibidas. La información captada a través de tracking y eventing se integra y almacena en el sistema formando un conjunto de datos de gran volumen.